MWBC — The USDA’s National Agricultural Statistics Service (NASS) released its farm production expenditures report for 2023, comparing total US farm expenses to the previous year of 2022. The reported increases are staggering.
“The 2023 total farm production expenditures are up 6.5 percent compared with 2022 total farm production expenditures.” (NASS release 7-26-24) At first glance, no one would be surprised by such an increase, considering our inflation rates over the last several years. You might assume those numbers run par to what the average consumer is feeling in their pocketbooks. But the catch with statistics is to study all sides of a number.
We want to dive into production agriculture specifically – those farms and ranches producing the great majority of our food. Here is where we find a more somber scenario. The cost of doing business for farms selling between $1 million and $5 million rose a whopping 15.6 percent in 2023. Similarly, the above-$5 million classification realized an increase, to the tune of 9.4 percent. Farm services and labor top the list of production expenses, followed by fertilizer and rent in that order.
This graph covers the last ten years of farm production in the US Expenses stabilized from 2016 – 2020, followed by a sharp increase in subsequent years. Stable costs are a critical factor for long term budgeting. Producers need some of their budget to be at least reasonably honest, to account for other wild swings such as hail losses or a sudden drop in wheat prices. Risk mitigation is so important, which is why expenses like seed or implements can make all the difference with margins.
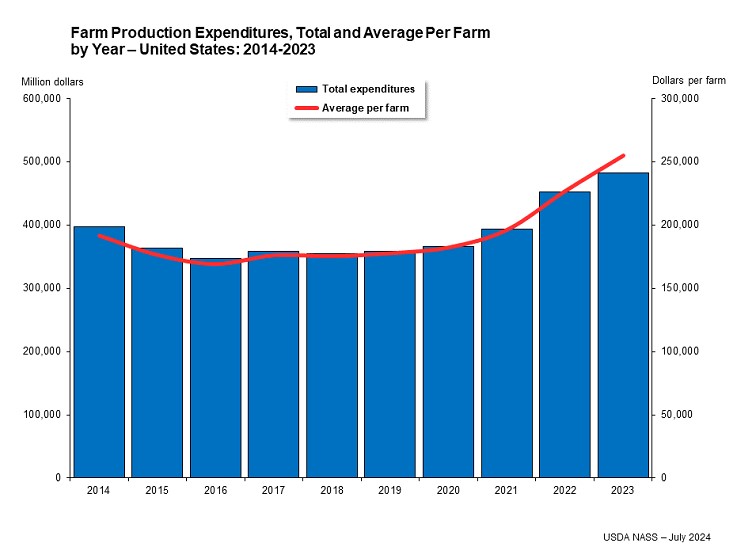
In review of this expenditures chart, you’ll note the 2023 US total per-farm expenditure average was $255,047. If you’re thinking, “Wow, those numbers don’t represent what we see on our place,” remember that ANY entity selling a minimum of $1,000 in ag products in a single year will be included in these totals. Those entities represent 79 percent of what is classified as a farm by the USDA. Our goal is to study the other 21 percent.
It is much more difficult to pull Montana data, because it is combined with the entire Rocky Mountain region. The 2022 Census of Agriculture lists about 3,700 Montana farms operating in the $500,000+ sales class. Julie Schmidt, NASS Mountain Regional Field Office, shared that this particular dataset is actually more targeted to production ag than perhaps other facts gathered by NASS. With that in mind, we can assume that these percentages do align with Montana production costs. And no one is arguing that production costs have skyrocketed, adding further stress to farm profitability. It’s an expensive farm.
Lori Wickett, MWBC Research & Development Director